Listen to the Podcast
10 Apr 2020 - Podcast #688 - (23:41)
It's Like NPR on the Web
If you find the information TechByter Worldwide provides useful or interesting, please consider a contribution.

If you find the information TechByter Worldwide provides useful or interesting, please consider a contribution.

How fast is your computer? Those who used to build and race hot rods might be interested, but should the rest of us? Maybe you should because these tests are about more than just having numbers you can brag about. If the computer seems to be slow, testing can show you where the problem is.
Starting with Vista, Microsoft offered the Windows Experience Index and that was available to users through version 8.1. Then it seemingly disappeared. Key word: SEEMINGLY. Like so many other discontinued Windows features, the Windows Experience Index is still there. It's well hidden and there's no longer a pretty graphical interface, but it's there.
The two main points here are:
If you're looking for a comprehensive set of tests that examine every part of the computer, you'll find Windows Experience Index to be seriously lacking. But it's also free and applications such as PC Mark 10 start at $1495 per year for business use. There is a $60 home-use version, a less full featured $30 version, and a basic testing suite that's free.
The basic Windows Experience Index has the advantages of being free, easy to use, and able to provide performance numbers that let users compare one computer to another. The test considers five major subsystems: the CPU, physical memory, the graphics subsystem, the gaming graphics hardware, and the primary hard disk drive.
Each subsystem test provides a score from 1.0 to 9.9 instead of listing various component scores within the subsystem. Then the computer's final score is shown as the lowest of all the subsystem scores. Testing professionals may well scoff at this technique, but it does quickly and accurately identify the slowest component in the computer. So the best possible score (9.9) would require the highest number for each subsystem. If even one subsystem scores 6.3, the overall machine score will be 6.3.
Click any small image for a full-size view. To dismiss the larger image, press ESC or tap outside the image.
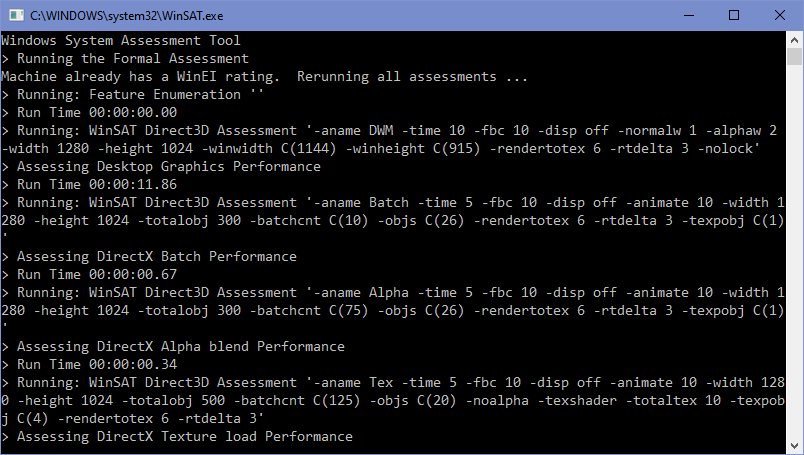 The test values are produced by the Windows System Assessment Tool (WinSAT) and the computer may be slow during the test. The screen will probably flash and may momentarily go blank as the video subsystem is tested.
To run the test, open a Command window (or a PowerShell window) and type winsat formal. Wait until the process competes.
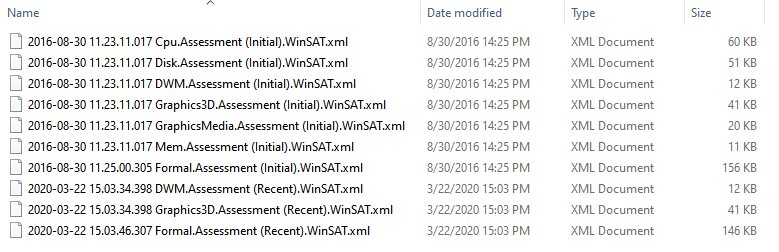 The results will be stored in C:\Windows\Performance\WinSAT\DataStore\ as a series of files that contain the results for each component of the test. The file names all begin with the year-month-date hour-minute-second-decimal, then the name of the file, the term WINSAT, and an XML extension.
Example: 2020-03-23 13.19.04.063 Formal.Assessment (Recent).WinSAT.xml
 Extensible Markup Language (XML) is a file type that's frequently used to transport data from one system to another. It's defined by a set of rules for encoding the information in a format that can be read by both machines and humans. There's a difference between "can be read" and "can be easily read".
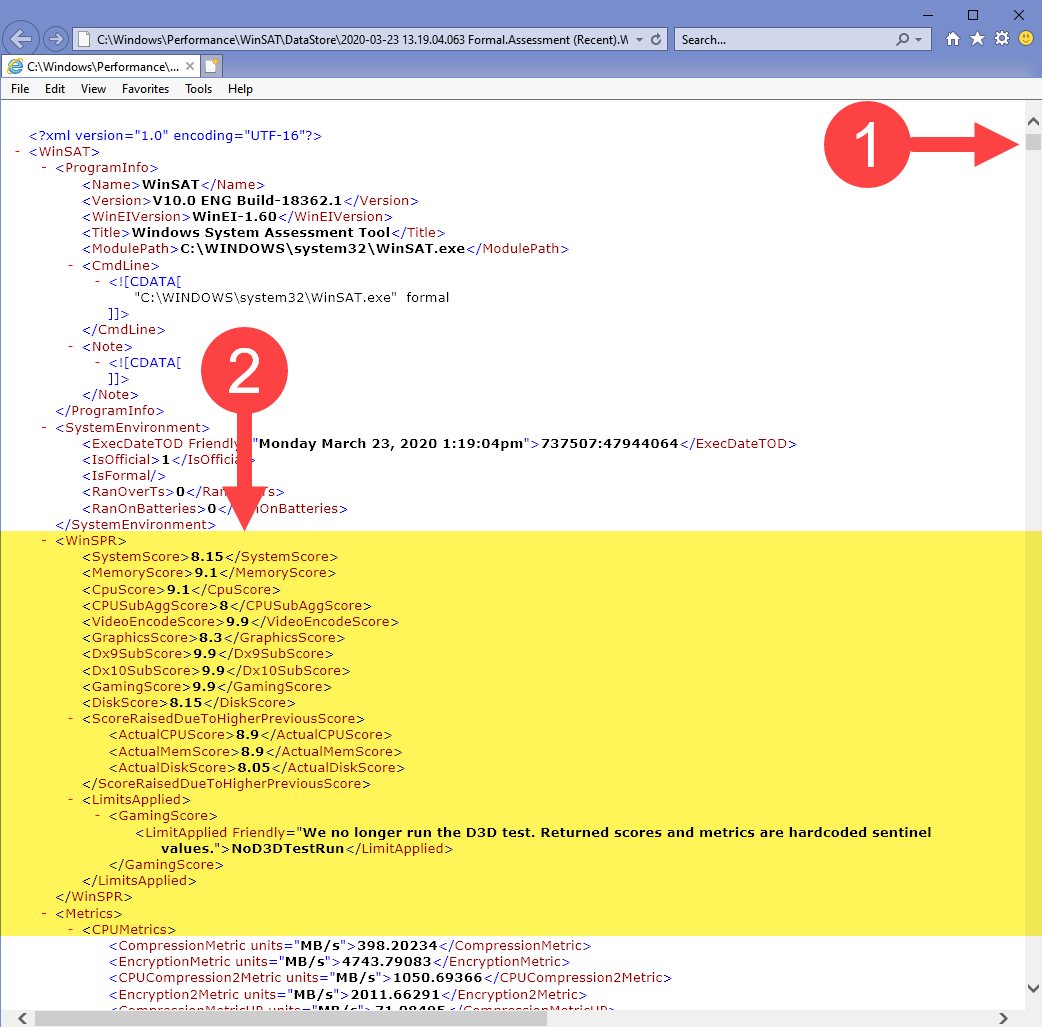
When you double-click the Formal.Assessment (Recent).WinSAT file, Windows will probably suggest using an Office XML File Handler. Although the XML file can be opened in nearly any web browser, choosing the Office XML File Handler is the best choice. It will open Windows Internet Explorer and display the file there. The first thing you may notice (1) based on the size and length of the scroll bar is that the file is enormous. To make the file human readable, the contents need to be astonishingly verbose.
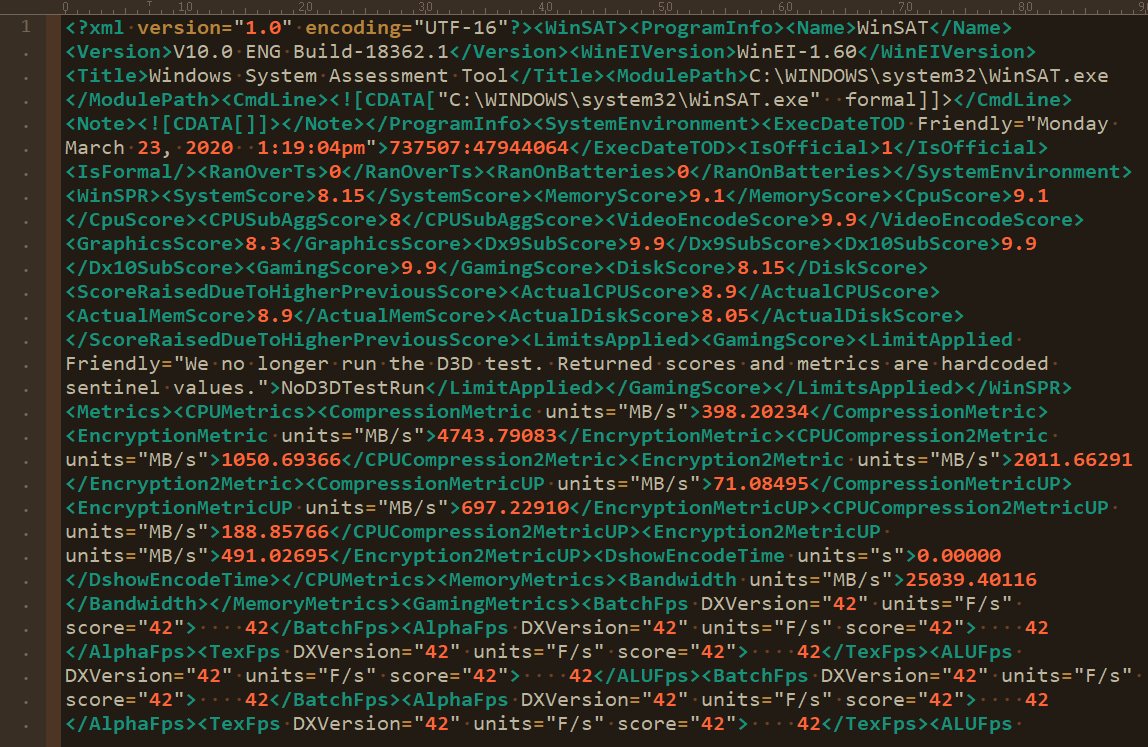 It's important to open the file in a program that understands XML. Opening the XML in any other application, such as a plain text editor, will produce a display that can still be read by humans but isn't very useful. The primary information you want is near the top of the file (2) between <WinSPR> and </WinSPR> tags. Each component is on its own line.
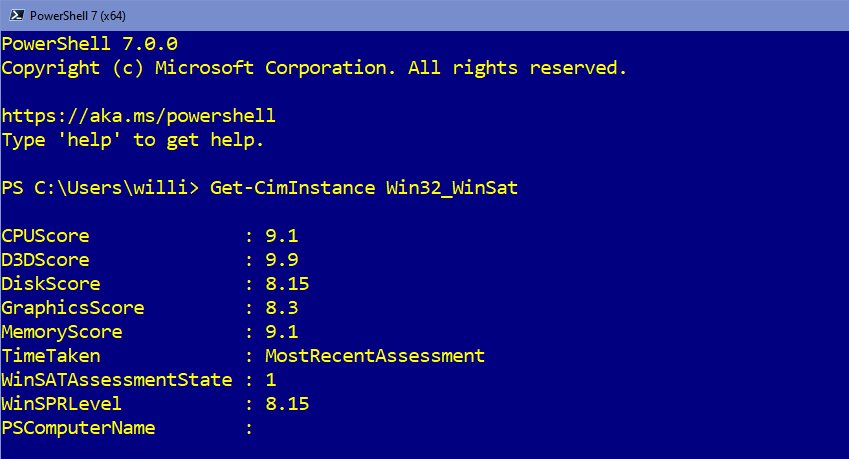 Other ways exist to view the store. For example, after running the winsat command, start PowerShell and type Get-CimInstance Win32_WinSat. This will display labeled values for each of the component scores and the overall score on the WinSPRLevel line.
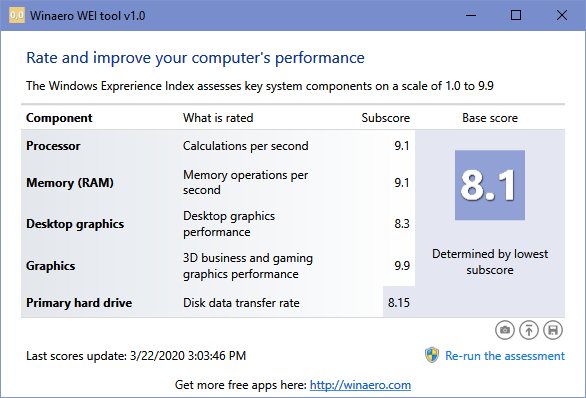 Instead of using PowerShell, you could download the free WinAero WEI tool and run it. This little utility doesn't even need to be installed. Just download it, unpack the zip file, and run WEI.exe. This will display the values in a way that looks a lot like the method Microsoft used between Windows Vista and Windows 8.1.
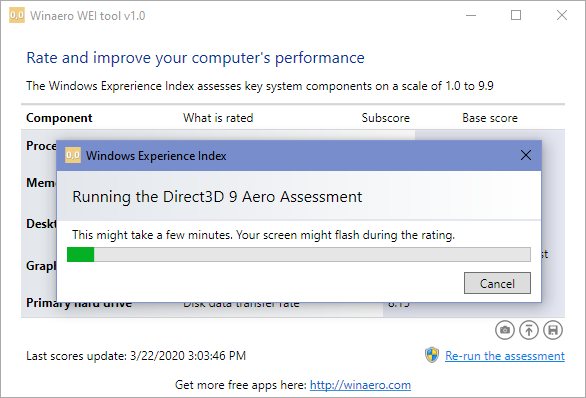 When the WEI utility is open, look at the lower right corner. You'll see these words: "Re-run the assessment". You may think that clicking that link would re-run the Windows Experience Index test and display the results.
You would be right.
So what's the point of walking around the barn three times and wandering out into the back 40 if there's a quick, simple, two-click solution? My point wasn't to frustrate or annoy and I apologize if that's what I did. The point is that Windows (and most operating systems) offer several ways to perform a single task.
Running the Windows Experience Index test manually and examining each of the resulting XML files will provide more information — information that a technician might want, but information that might be too much for people who simply want to find out which computer subsystem is making the machine slow.
Buying the $60 home version of a $1500 diagnostic tool will provide even more information, so the decision involves contemplating how valuable additional information would be and how it can be used to improve your computing experience.
By the way, my working title for this segment was How Fast is that Computer in the Windows?, but I concluded that only those of a certain age would make the goofy connection with the 1953 hit song (recorded in 1952) by Patti Paige and that anyone who did make the connection would never forgive me. So I changed the title.
These are tough times and it's far from clear when conditions will improve. For a lot of people, the situation is more than just tough; it's desperate. Not to disregard or even downplay the desperation, resources such as music, books, motion pictures, and television programs can help reduce stress.
I was going to spend some time this week talking about the paid versions of music streaming services such as Spotify, Pandora, and Apple Music. All of the services have free versions with varying levels of annoyances from ads and other intrusions. Of course these services require internet service, but the internet is so important that I'm going to assume that even those in desperate situations will try to maintain connectivity.
Click any small image for a full-size view. To dismiss the larger image, press ESC or tap outside the image.
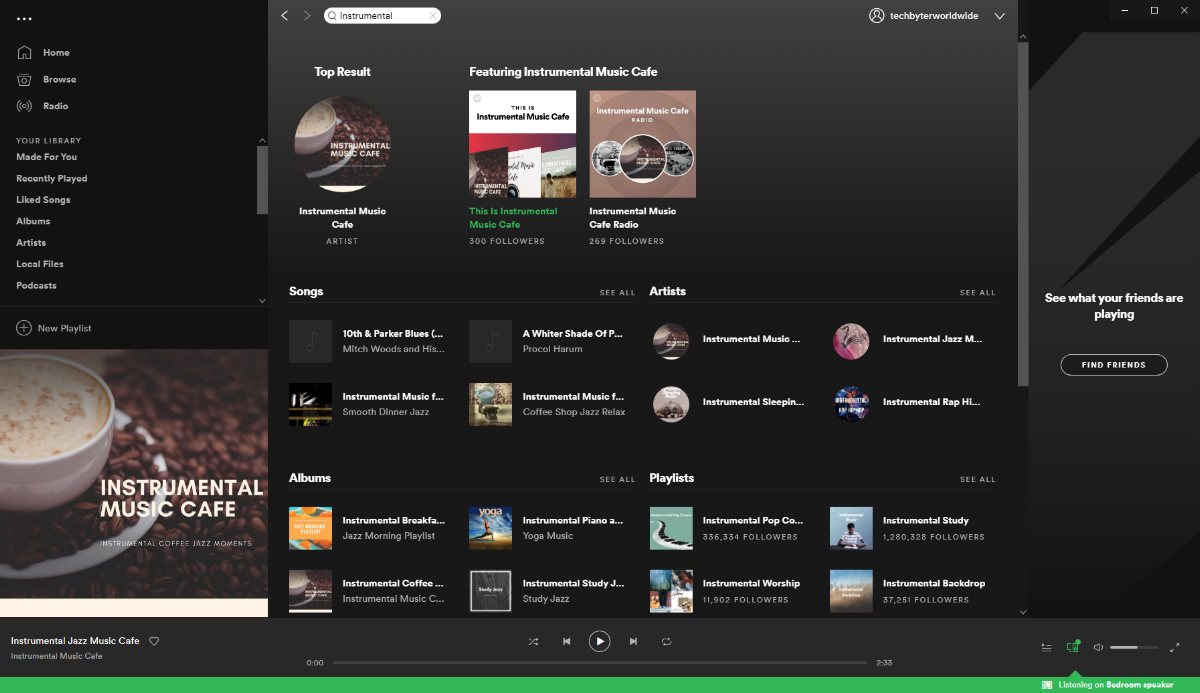 Let's look briefly at Pandora and Spotify. Pandora is older and a limited paid version costs less than Spotify's paid version. Pandora is now owned by SiriusXM and, although I've used it for several years, I switched to Spotify this spring. If you have the budget for the paid service, you'll get music without the ads or other interruptions. Pandora costs $5/month or $10/month, and Spotify is $10/month.
Both services have around 20 million selections to choose from. Pandora seems to have a better method for finding new music, but Spotify has a weekly "Discover" playlist that's helpful if you want to find what's new. Both services include podcasts for those who want more than just music. If you have to stick with the free version, Spotify is generally regarded as the better service.
But there are many other options, too. Nearly every radio station has a streaming service that works with a web browser or a smart speaker. IHeart Media lets you listen to its radio stations and also has paid streaming services. The All Access service costs $10/month for Android users and $13/month for IOS users. The Plus service is $5/month.
Many libraries offer streaming music for free — all you need is a library card. Libraries are closed now because of the pandemic, but a lot of them will allow you to sign up for a digital-access card online. Besides music, you'll also have access to research materials, lots of other digital resources, and ebooks.
The music isn't quite like playing a CD. My library offers choices of 24Kbps and 64Kbps. By comparison, the TechByter Worldwide podcast is encoded at 112Kbps and top-quality audio will be encoded at 256Kbps or 320Kbps. So the values used for online streaming may seem unacceptably low, but that's probably not the case. The 48Kbps bit rate approximates the sound of a good AM radio station on a high-quality radio without static. Not exactly what you want for critical listening, but our desires have changed in the past 50 years.
In the 1970s and 1980s, we had big, heavy turntables that were expensive. We had big, heavy amplifiers that were expensive. We had big, heavy speakers that were expensive. The goal was the best possible sound we could get while sitting on a big, heavy sofa — positioned precisely between the two speakers. Then Sony introduced the Walkman in 1979 and that changed everything. We became less interested in having the best audio quality and more interested in being able to carry our music with us.
 In addition to wanting portable music, we now want music that we can play on any device we own and wherever we are. The MP3 music format is lossy, but it's acceptable for casual listening and it's perfect for streaming. During the time I was writing this segment, I was listening to Ludwig van Beethoven's Three Sonatas for Flute and Piano performed by Francesca Paganini and Stefano Malferrari at 64Kbps from my library's Alexander Street service. By comparison, Spotify offers bit rates from 24Kbps to 320Kbps. The higher 256Kbps and 320Kbps rates are available only to paid subscribers. When I switch from the library service's free 64Kbps streaming service to Spotify at 320Kbps there is a clearly audible difference. Lower bit-rates can result in harsh-sounding music. Higher bit-rates carry more information and more information makes transitions smoother. Music has a lot of transitions.
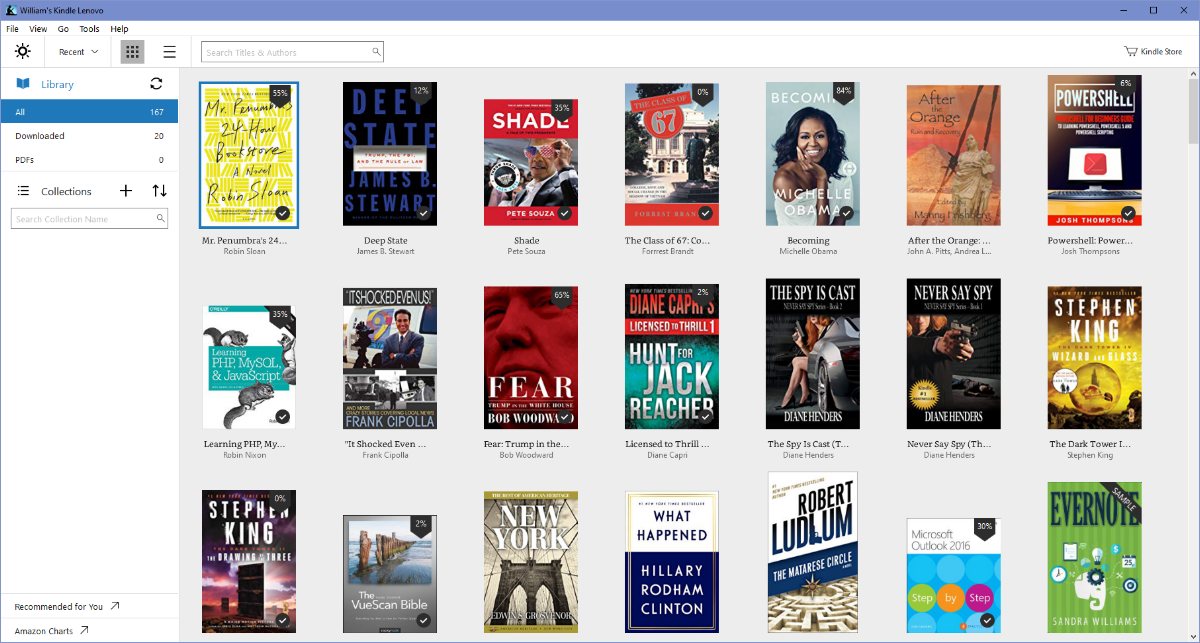 Libraries are still able to fulfill requests for ebooks. Physical books and other media such as CDs and DVDs aren't available, but ebooks can be read on phones, tablets, and computers. Library ebooks can be loaded to Kindle devices or the Kindle reader on non-Amazon devices. Most libraries also offer books in EPUB format. Books in this format need Adobe Digital Editions. Many libraries around the country have stopped charging late fees for physical materials and ebooks also have no late fees because they are automatically returned when they're due.
 The Columbus Metropolitan Library offers a variety of services that are available to anyone in Ohio who has a Columbus library card. If you don't have one, you can apply online and the library will email the card number to you. Most states have libraries in large cities that provide statewide access. Patrons can choose from ebooks and audio books provided by Overdrive; movies, music, and audio books from Hoopla; classic motion pictures, indie films, and documentaries from Kanopy; digital magazines from Flipster; audio books from RB Digital; access to historical resources; and online classes, research, and instructions for do-it-yourself projects.
Being stuck inside is rarely a good thing, but we do have options that will help us make the best of these trying times. And maybe this current situation will make government at all levels understand the importance of internet connectivity for everyone. Far too many areas are under-served.
If streaming audio and video are too much for your current internet service, reading books online or downloading them works with even slow systems. And when even that is too much, consider connecting briefly and using recommendations you'll find on the web to identify activities, many of which don't require an internet connection:
Scammers aren't stupid. They watch the news and adapt their messages to fit the narrative. What's distressing is that people continue to fall for the same old scams that have simply been repackaged in new clothing. Then tech writers like me have to write the same old stories and dress them up with new specifics. It shouldn't be this way.
The tried and true protective measures kept us safe from the scammers' previous ploy and the one before that. And the one before that. And the one before that. New threats are simply variations on a theme. So here's the rundown again:
 Pay attention. If anything about a message seems even a bit hinky, stop! Think about what you want to do. Don't follow that link. If the message is from somebody you don't know, don't reply. A legitimate sender (and even a lot of phonies) will try again. It's better to ignore a questionable message several times than to get caught in a scam.
Phishing emails have hit an all-time high now that many people are working from home. Spams promote scam cures for COVID-19 and tout phony protective measures. Messages that claim to come with important information carry attachments that will install malware when you open them. Vigilance, skepticism, and a tiny bit of healthy paranoia will keep you, your computer, and your money safe from the creeps who want to take advantage of a bad situation.